| Version 5 (modified by ryland, 16 years ago) |
|---|
Monthly report
The dimensions defined in the "Monthly Production Report project" are depicted in the graph below. Click on a class name to get further details.
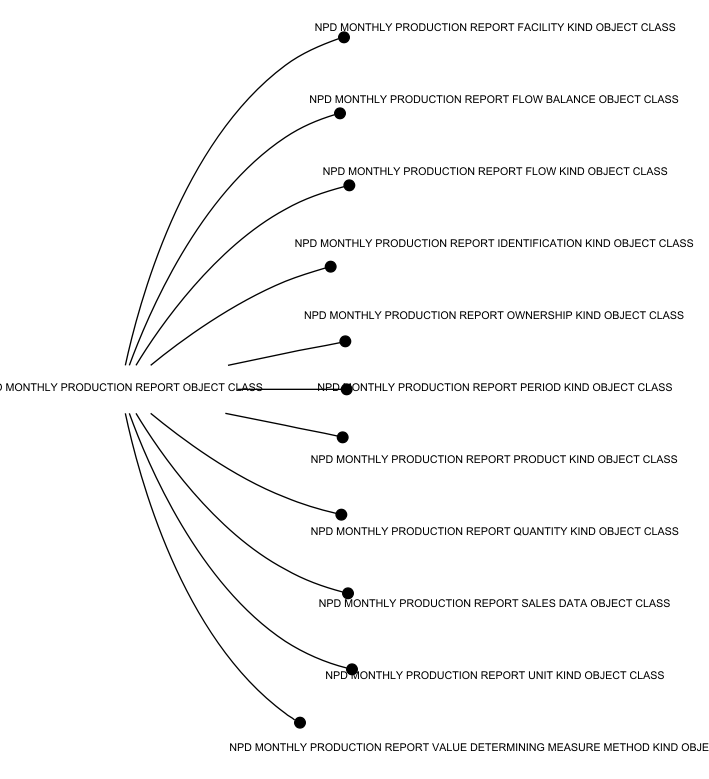
Monthly report dimensions
The following are links to graphical depictions of the taxonomy hierarchies of the classes defined in the different dimensions of the Monthly Production Report Project.