| Version 4 (modified by jowik, 16 years ago) |
|---|
Drawing ISO 15926 diagrams using LaTeX macros
This page describes how content in ISO 15926 format can be represented in diagrams, using LaTeX, the xy-pic extension, and macros defined in the templatediagram.sty style.
The diagrams described here use the graph feature of xy-pic (see the xy-pic reference manual, section 26). The full xy-pic language is very expressive, and not exactly easy to understand for people with only finite time on their hands. However, to get started with ISO 15926 diagrams all that is needed is a tiny number of commands. This page will teach you how to draw diagrams with very little effort.
Getting started
There are two main options.
- Enter diagrams into a page in this Trac, as described below. For experimentation, consider the SandBox.
- For adding diagrams to your own LaTeX documents, download templatediagram.sty. (If you are just starting out with LaTeX, see http://www.tug.org/begin.html for some useful pointers to software and documentation.)
Creating diagrams on Trac pages
1. The diagram container
The first thing you need to do is to add a section to your Trac page that looks as follows.
{{{
#!LatexEquation
\TemplateDiagram{

         The diagram goes here!

 }
}}}
2. Adding a class: the class macro !c
Classes are inserted into a diagram using the macro !c, which must be followed by three arguments, all enclosed in curly braces. A diagram of ISO 15926 content should always show the entity type of each element. This means the macro for adding a class has one argument for the element name, and one for the type name. In addition, we usually need to assign a name to each element in the diagram, so that we can refer to them later.
!c{ diagram identifier }{ class name }{ entity type name }
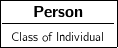
To enter a Class of Individual named Person, add "!c{person}{Person}{Class of Individual}" to the digram container:
{{{
#!LatexEquation
\TemplateDiagram{
  !c{person}{Person}{Class of Individual}
 }
}}}
This input produces the following graph.
3. Adding a second class: diagram hops with [r], [l], [d], and [u]
For example, let's say we wish our diagram to express that the class Child is a subclass of Person. We will need to place a Child class box in the diagram at a suitable distance from the Person box.
For moving around in the digram, we use the common xy-pic statements.
- [r] right, [l] left, [d] down, [u] up.
These can be combined quite flexibly for hopping around on the canvas, for instance:
- [rr] two right hops, [ddr] two hops down, then one to the right
In order to leave room for a relationship symbol, we will move two hops two the right before drawing the Child class box.
{{{
#!LatexEquation
\TemplateDiagram{
  !c{person}{Person}{Class of Individual}
  [rr]
  !c{child}{Child}{Class of Individual}
 }
}}}
We now have the following graph.